
Infrastructure
The Performance Monitoring Myth: Why Fast Hosting Isn't Enough
Everyone says that website speed is just about having fast hosting. You have probably heard this from your web developer, read it in hosting comparison articles, or been told by sales representatives that upgrading to premium hosting will solve all your performance problems. This myth is costing Irish businesses thousands in lost revenue every month. The reality? Your hosting server speed accounts for roughly 20% of your website's actual performance. The other 80% comes from factors that expensive hosting cannot fix: bloated plugins, oversized images, third-party tracking scripts, and unoptimised databases. Performance monitoring tools can reveal what is actually slowing down your website, but most Irish SMEs either do not have access to proper monitoring or do not understand how to interpret the data they are collecting.
The Hidden Cost of Performance Ignorance
Let me start with numbers that matter to your bottom line.
According to recent Google and Deloitte research, a 0.1 second improvement in mobile site speed increases retail conversions by 8.4%. That translates to real money. More than half of mobile users abandon sites that take more than 3 seconds to load, as Google consistently reports year after year.
Here is where it gets interesting for Irish businesses specifically. A solicitor in Sligo recently discovered through performance monitoring that his contact form was taking 7.2 seconds to load on mobile devices. Not because of slow hosting, but because of an outdated contact plugin loading twelve different JavaScript libraries. Every potential client who tried to enquire on their phone during their lunch break simply gave up. The hosting was lightning fast. The user experience was terrible.
Websites that load in 1 second achieve conversion rates three times higher than those loading in 5 seconds, according to a comprehensive Portent study from 2023. Yet more than 50% of websites still fail Google's Core Web Vitals assessment as of 2024, despite these metrics being readily available through free monitoring tools.
The performance monitoring market tells its own story. As Business Research Insights reported, the global website performance monitoring tool market was valued at $3.75 billion in 2024 and is projected to reach $9.04 billion by 2033. Companies are investing heavily in understanding what actually affects their website speed — for a broader perspective, read the complete WordPress performance guide for Irish businesses. The ones that are not? They are losing ground to competitors who understand that fast hosting is just the starting point, not the finish line.
Deconstructing the 'Fast Hosting' Myth
The hosting industry has done an excellent job of convincing business owners that server performance equals website performance. It does not.
Your hosting server handles one job: delivering your website files when someone requests them. Modern hosting providers like Web60 can serve a basic HTML page in under 100 milliseconds from Irish infrastructure. That part is solved. What happens next determines whether your visitor waits 1 second or 10 seconds for a usable page.
Consider the anatomy of a typical WordPress site loading:
- Server response time: 200ms
- Theme CSS files: 800ms
- JavaScript libraries: 1,200ms
- Plugin assets: 600ms
- Images loading: 2,400ms
- Third-party scripts (analytics, chat widgets, social media): 1,800ms
Total loading time: 7 seconds. The hosting performed perfectly. Everything else failed.
Mordor Intelligence research from 2024 reveals that average page weight climbed 35% last year as 3D product viewers and high-resolution imagery became baseline merchandising tools. Your hosting server can deliver a 5MB page just as quickly as a 500KB page. But your customer's phone in rural Cork cannot process 5MB of unoptimised assets without significant delay.
This is why Kinsta, despite having excellent enterprise infrastructure, genuinely suits large agencies managing 50+ sites with dedicated DevOps teams. Their server-level optimisations work brilliantly when you have technical staff optimising everything else. For a typical Irish SME without that expertise? Fast hosting becomes an expensive band-aid on deeper performance problems.

The Real Performance Killers Hiding in Plain Sight
Performance monitoring reveals the actual culprits behind slow websites. These are the issues that no amount of hosting upgrades can fix.
Plugin Bloat and Resource Conflicts
The average WordPress site runs 22 plugins, according to WP White Security data. Each plugin can add CSS files, JavaScript libraries, database queries, and external API calls. Popular plugins like WooCommerce, Yoast SEO, and contact form builders often load their assets on every page, even when not needed.
One monitoring analysis showed a business directory plugin adding 1.8 seconds to page load time by querying an external mapping service on every page load. The business owner had no idea this was happening until performance monitoring exposed the issue.
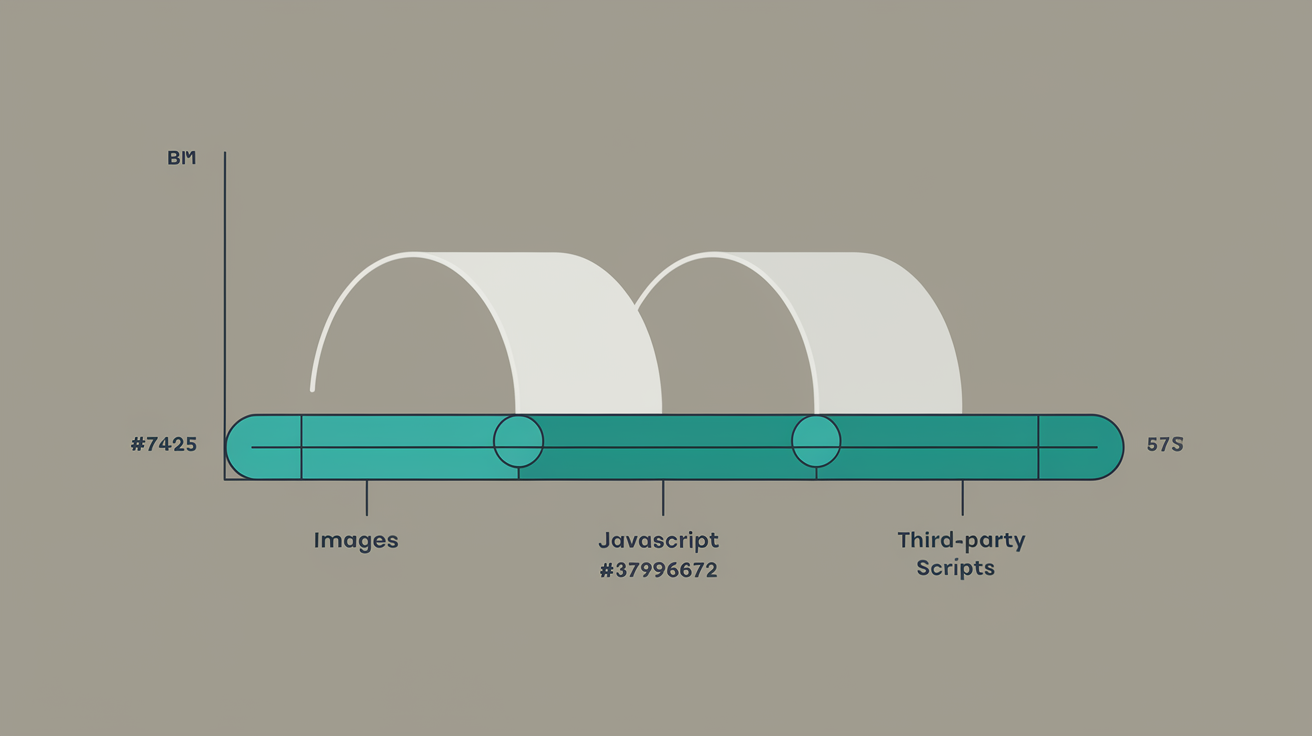
Image Optimisation Failures
Images typically account for 60-70% of page weight, yet most WordPress sites serve unoptimised images. A product photo uploaded at 3MB loads as 3MB, even when displayed at 300px wide on mobile devices. Modern image formats like WebP can reduce file sizes by 80% without visible quality loss, but require proper implementation.
Performance monitoring tools track Largest Contentful Paint (LCP), which measures when the main content becomes visible. Images are usually the largest contentful element, making image optimisation critical for this Core Web Vital metric.
Third-Party Script Performance Drain
Google Analytics, Facebook Pixel, chat widgets, email capture popups, and social media embeds all add external dependencies to your site. Each third-party script introduces potential delays, especially if the external service experiences slowdowns.
Farfetch's case study from 2024 demonstrated that each 100ms of LCP delay suppressed conversions by 1.3%. Meanwhile, reducing Time to Interactive lifted conversions by 2.8% — we explore how site speed directly affects customer retention in more detail. These metrics only become actionable through proper performance monitoring that tracks real user experiences, not just server response times.
Database Query Inefficiency
WordPress generates database queries for every page load. Poorly coded themes or plugins can trigger hundreds of unnecessary queries. A recent audit discovered a events calendar plugin generating 847 database queries per page load to display three upcoming events. The hosting database server was responding quickly to each query, but 847 rapid-fire queries still created noticeable delays.
Core Web Vitals: The Metrics That Actually Predict Business Impact
Google replaced technical server metrics with user experience metrics for good reason. Core Web Vitals measure what your customers actually experience, not what your hosting dashboard reports.
Largest Contentful Paint (LCP)
LCP measures when the main content becomes visible. Good LCP scores fall under 2.5 seconds. This metric correlates directly with bounce rates and conversion performance. Vodafone achieved an 8% increase in online sales after improving their LCP by 31%, as reported in Email Vendor Selection research.
LCP problems rarely stem from hosting speed. Common culprits include:
- Unoptimised hero images
- Render-blocking CSS and JavaScript
- Slow-loading web fonts
- Above-the-fold content blocked by third-party scripts
Interaction to Next Paint (INP)
Google replaced First Input Delay with INP in March 2024. INP measures how quickly pages respond to user interactions like clicks, taps, and keyboard input. This metric directly affects user frustration levels.
Hosting speed has minimal impact on INP scores. JavaScript execution efficiency matters far more. Heavy JavaScript frameworks, unoptimised event handlers, and blocking scripts create poor INP scores regardless of server performance.
Cumulative Layout Shift (CLS)
CLS measures visual stability during page loading. Elements that move or shift position create poor user experiences and low CLS scores. This metric has zero correlation with hosting performance.
Common CLS issues include:
- Images loading without defined dimensions
- Advertisements inserting above content
- Dynamic content loading asynchronously
- Web fonts swapping during load
Rakuten optimised their Core Web Vitals and saw conversion rates jump by 33% and revenue per visitor increase by 53%, according to Email Vendor Selection analysis. These improvements required systematic performance monitoring and optimisation across multiple website layers, not hosting upgrades.
Real-World Performance Monitoring in Action
Performance monitoring transforms abstract data into actionable insights. Here is how it works in practice.
Identifying Bottlenecks Through Real User Monitoring
Synthetic tests from tools like Google PageSpeed Insights provide baseline measurements, but Real User Monitoring (RUM) reveals actual performance across different devices, network conditions, and user behaviours.
One Irish e-commerce site discovered through RUM data that mobile users experienced 40% slower loading times between 12pm and 2pm. The cause? A lunch-time traffic spike overwhelming a third-party inventory checking API. The hosting infrastructure handled the traffic perfectly, but the external dependency created cascading delays.
Performance Budget Implementation
Performance monitoring enables setting and enforcing performance budgets. For example:
- Total page weight: maximum 1.5MB
- JavaScript bundle size: maximum 300KB
- Third-party scripts: maximum 3 domains
- LCP target: under 2.5 seconds
- INP target: under 200ms
When new features or content exceed these budgets, monitoring alerts trigger immediate investigation.
Conversion Impact Tracking
Advanced monitoring correlates performance metrics with business outcomes. This analysis might reveal:
- 1-second LCP improvement = 8% conversion increase
- CLS score under 0.1 = 15% lower bounce rate
- INP under 100ms = 12% higher average session duration
These correlations help prioritise optimisation efforts based on business impact, not just technical metrics.
Competitive Performance Benchmarking
Monitoring tools can track competitor performance, revealing opportunities for differentiation. If your industry average LCP is 4.2 seconds, achieving 2.1 seconds creates a significant competitive advantage in user experience and Google rankings.
Relive achieved over 50% faster LCP and almost zero layout shifts through systematic monitoring and optimisation, resulting in a 3% conversion rate increase, 6% decrease in bounce rate, and 9% increase in page views per session, as documented by WPO Stats.
Why Web60's Approach to Performance Monitoring Actually Works
Most hosting providers offer performance monitoring as a dashboard full of charts and numbers. Web60 takes a different approach: AI-powered recommendations that translate technical data into specific actions.
Beyond Raw Data: Actionable Intelligence
Web60's performance monitoring integrates with Google PageSpeed Insights but adds contextual analysis for Irish business requirements. Instead of showing "LCP: 3.2 seconds," the system explains: "Your hero image is delaying main content visibility by 800ms. Optimising this image to WebP format and adding proper dimensions will improve loading speed and potentially increase mobile conversions by 6-8%."
This approach addresses the gap where, according to industry research, 72% of companies use AI tools for Core Web Vitals optimisation but struggle with proper implementation.
Irish-Specific Performance Benchmarking
Web60 provides Dublin-specific performance benchmarks based on Irish infrastructure and user behaviour patterns. This local context helps businesses understand their performance relative to Irish competitors, not global averages that may not reflect local network conditions or user expectations.
Proactive Issue Detection
While most monitoring solutions alert you after problems affect customers, Web60's AI-powered system identifies potential issues before they impact user experience. The platform monitors performance trends and predicts when metrics are likely to degrade based on content changes, plugin updates, or traffic patterns.
Performance-Business Metrics Integration
Web60 connects Core Web Vitals improvements to business outcomes through integrated analytics. The platform tracks how LCP improvements correlate with reduced bounce rates, how INP optimisations affect conversion funnels, and how CLS fixes impact customer satisfaction metrics.
Automatic Optimisation Suggestions
Rather than requiring technical expertise to interpret performance data, Web60's system provides prioritised action items:
- "Optimise 3 images above 500KB (estimated 1.2s LCP improvement)"
- "Defer non-critical JavaScript (estimated 400ms INP improvement)"
- "Enable object caching for dynamic queries (estimated 0.8s response time improvement)"
Each suggestion includes effort estimation and expected impact, helping businesses prioritise improvements based on available resources and potential returns.
This comprehensive approach ensures that Irish businesses get the benefits of enterprise-level performance monitoring without requiring dedicated technical teams to interpret and act on the data.
Performance Monitoring Strategy for Irish Business Websites
Implementing effective performance monitoring requires understanding which metrics matter for your specific business context and how to act on the insights generated.
Essential Metrics for Different Business Types
E-commerce sites should prioritise conversion-focused metrics:
- Cart abandonment correlation with page load times
- Checkout process completion rates by device and network speed
- Product page engagement metrics tied to image loading performance
- Search functionality responsiveness during peak traffic
Service-based businesses need different focus areas:
- Contact form completion rates across devices
- Information page engagement and time-on-page metrics
- Local search performance and mobile usability
- Call-to-action visibility and interaction timing
Content publishers require engagement-specific tracking:
- Reading completion rates by article load time
- Social sharing correlation with page performance
- Comment form usability and submission success rates
- Advertisement loading impact on content consumption
Setting Realistic Performance Targets
Irish businesses should establish performance targets based on local context rather than global benchmarks. Factors affecting Irish website performance include:
- Rural broadband limitations affecting mobile users outside major cities
- High smartphone usage requiring mobile-first optimisation
- GDPR compliance requirements affecting tracking implementation
- Local competition benchmarks within specific industries
Monthly Performance Review Process
Establish systematic monthly reviews covering:
- Core Web Vitals trend analysis: Track LCP, INP, and CLS improvements or degradations
- Business impact correlation: Connect performance changes to conversion rates, bounce rates, and revenue
- Competitive positioning: Monitor how your performance compares to industry benchmarks
- Technical debt assessment: Identify accumulating issues requiring attention
- Optimisation priority planning: Plan next month's improvements based on impact potential
Budget Allocation for Performance Improvements
Allocate performance improvement budget across:
- Image optimisation tools and CDN services (30%)
- Plugin auditing and replacement (25%)
- Professional development for critical issues (25%)
- Monitoring tools and analysis software (20%)
This allocation ensures systematic improvement rather than reactive problem-solving.
Integration with Marketing and Sales Efforts
Performance monitoring should inform marketing decisions:
- Landing page optimisation based on conversion correlation data
- Campaign timing adjusted for peak performance periods
- Device targeting informed by performance variations
- Content strategy influenced by engagement metrics tied to loading speed
By treating performance monitoring as business intelligence rather than technical maintenance, Irish businesses can use these insights for competitive advantage and customer experience improvement.
Conclusion
The myth that fast hosting equals fast websites has cost Irish businesses countless opportunities and revenue. Performance monitoring reveals the truth: hosting speed matters, but it represents just one piece of a complex puzzle. Real website performance depends on optimised images, efficient plugins, streamlined code, and well-configured third-party integrations. Web60's AI-powered performance monitoring goes beyond traditional hosting dashboards by providing actionable insights specifically tailored for Irish businesses. Instead of drowning in technical data, you get clear recommendations that directly impact your bottom line. The platform's Dublin-based infrastructure ensures accurate local performance measurement, while automated suggestions translate complex metrics into simple action items. Ready to discover what is actually slowing down your website? Try Web60's managed WordPress hosting free — the 60-second site setup includes comprehensive performance monitoring that shows you exactly where your site stands and what improvements will deliver the biggest impact for your business.
Frequently Asked Questions
How do I know if my website performance problems are caused by hosting or other factors?
Use tools like Google PageSpeed Insights and GTmetrix to identify specific bottlenecks. If your server response time (TTFB) is under 200ms, hosting is not the primary issue. Look for large image files, excessive plugins, third-party scripts, and unoptimised code as the main culprits. Performance monitoring tools can show you exactly which elements are causing delays.
What are Core Web Vitals and why do they matter for my Irish business?
Core Web Vitals are Google's user experience metrics: Largest Contentful Paint (loading speed), Interaction to Next Paint (responsiveness), and Cumulative Layout Shift (visual stability). They directly affect your Google search rankings and customer conversion rates. Irish businesses see immediate improvements in both search visibility and sales when these metrics are optimised.
Can performance monitoring actually help increase my website conversions?
Yes, performance monitoring identifies specific issues that drive customers away. Studies show that 1-second loading improvements can increase conversions by 8.4% for retail sites. By tracking which performance factors correlate with customer behaviour, you can prioritise optimisations that deliver measurable business results, not just better test scores.
How often should I check my website performance metrics?
Monitor Core Web Vitals weekly and conduct comprehensive performance reviews monthly. Set up automated alerts for significant performance degradation so you can address issues before they impact customers. Major changes like plugin updates, new content, or traffic spikes should trigger immediate performance checks.
What is the difference between synthetic monitoring and real user monitoring?
Synthetic monitoring tests your site from controlled environments using tools like PageSpeed Insights. Real User Monitoring (RUM) tracks actual visitor experiences across different devices, locations, and network conditions. Both are valuable: synthetic tests help identify issues, while RUM shows real-world performance and business impact.
Do I need technical expertise to benefit from performance monitoring?
Not with properly designed monitoring tools. While raw performance data requires technical interpretation, modern platforms like Web60 translate metrics into business-focused recommendations. Look for monitoring solutions that explain what improvements mean for your customers and revenue, not just technical scores.
Sources
Google and Deloitte research on mobile site speed and retail conversions, available through Queue-it ecommerce website speed statistics
Google data on mobile user abandonment rates, referenced in Landbase conversion rate statistics
Portent study on loading speed impact on conversion rates, cited by HubSpot marketing blog
Business Research Insights report on Website Performance Monitoring Tool Market valuation and projections
Mordor Intelligence analysis of web performance market size and growth forecasts
Email Vendor Selection research on Core Web Vitals business impact case studies
WPO Stats documentation of performance optimisation case studies and results
Graeme Conkie founded SmartHost in 2020 and has spent years building hosting infrastructure for Irish businesses. He created Web60 after seeing the same problem repeatedly — Irish SMEs paying too much for hosting that underdelivers. He writes about WordPress infrastructure, server security, developer workflows, managed hosting strategy, and the real cost of hosting decisions for Irish business owners.
More by Graeme Conkie →Ready to get your business online?
Describe your business. AI builds your website in 60 seconds.
Build My Website Free →More from the blog
Why Irish Web Agencies Are Abandoning Managed Hosts That Block Professional Development Tools
Why Irish web agencies are abandoning managed hosts that block SSH, WP-CLI, and terminal access. Professional WordPress development requires professional tools.
Why Irish Restaurant Social Media Success Crashes Your WordPress Site (And How to Prepare for Viral Moments)
When social media drives 2,000+ visitors in 10 minutes, standard hosting crashes. Learn how Irish restaurants prepare for viral moments with auto-scaling infrastructure.