
Your Web60 dashboard includes a built-in Analytics section that tells you how your website is performing. This article explains each number you will see on the main overview screen and offers tips on what they mean for your business.
Opening the Analytics overview
- Log in to your Web60 dashboard.
- Select the website you want to review.
- Click Analytics in the left-hand sidebar.
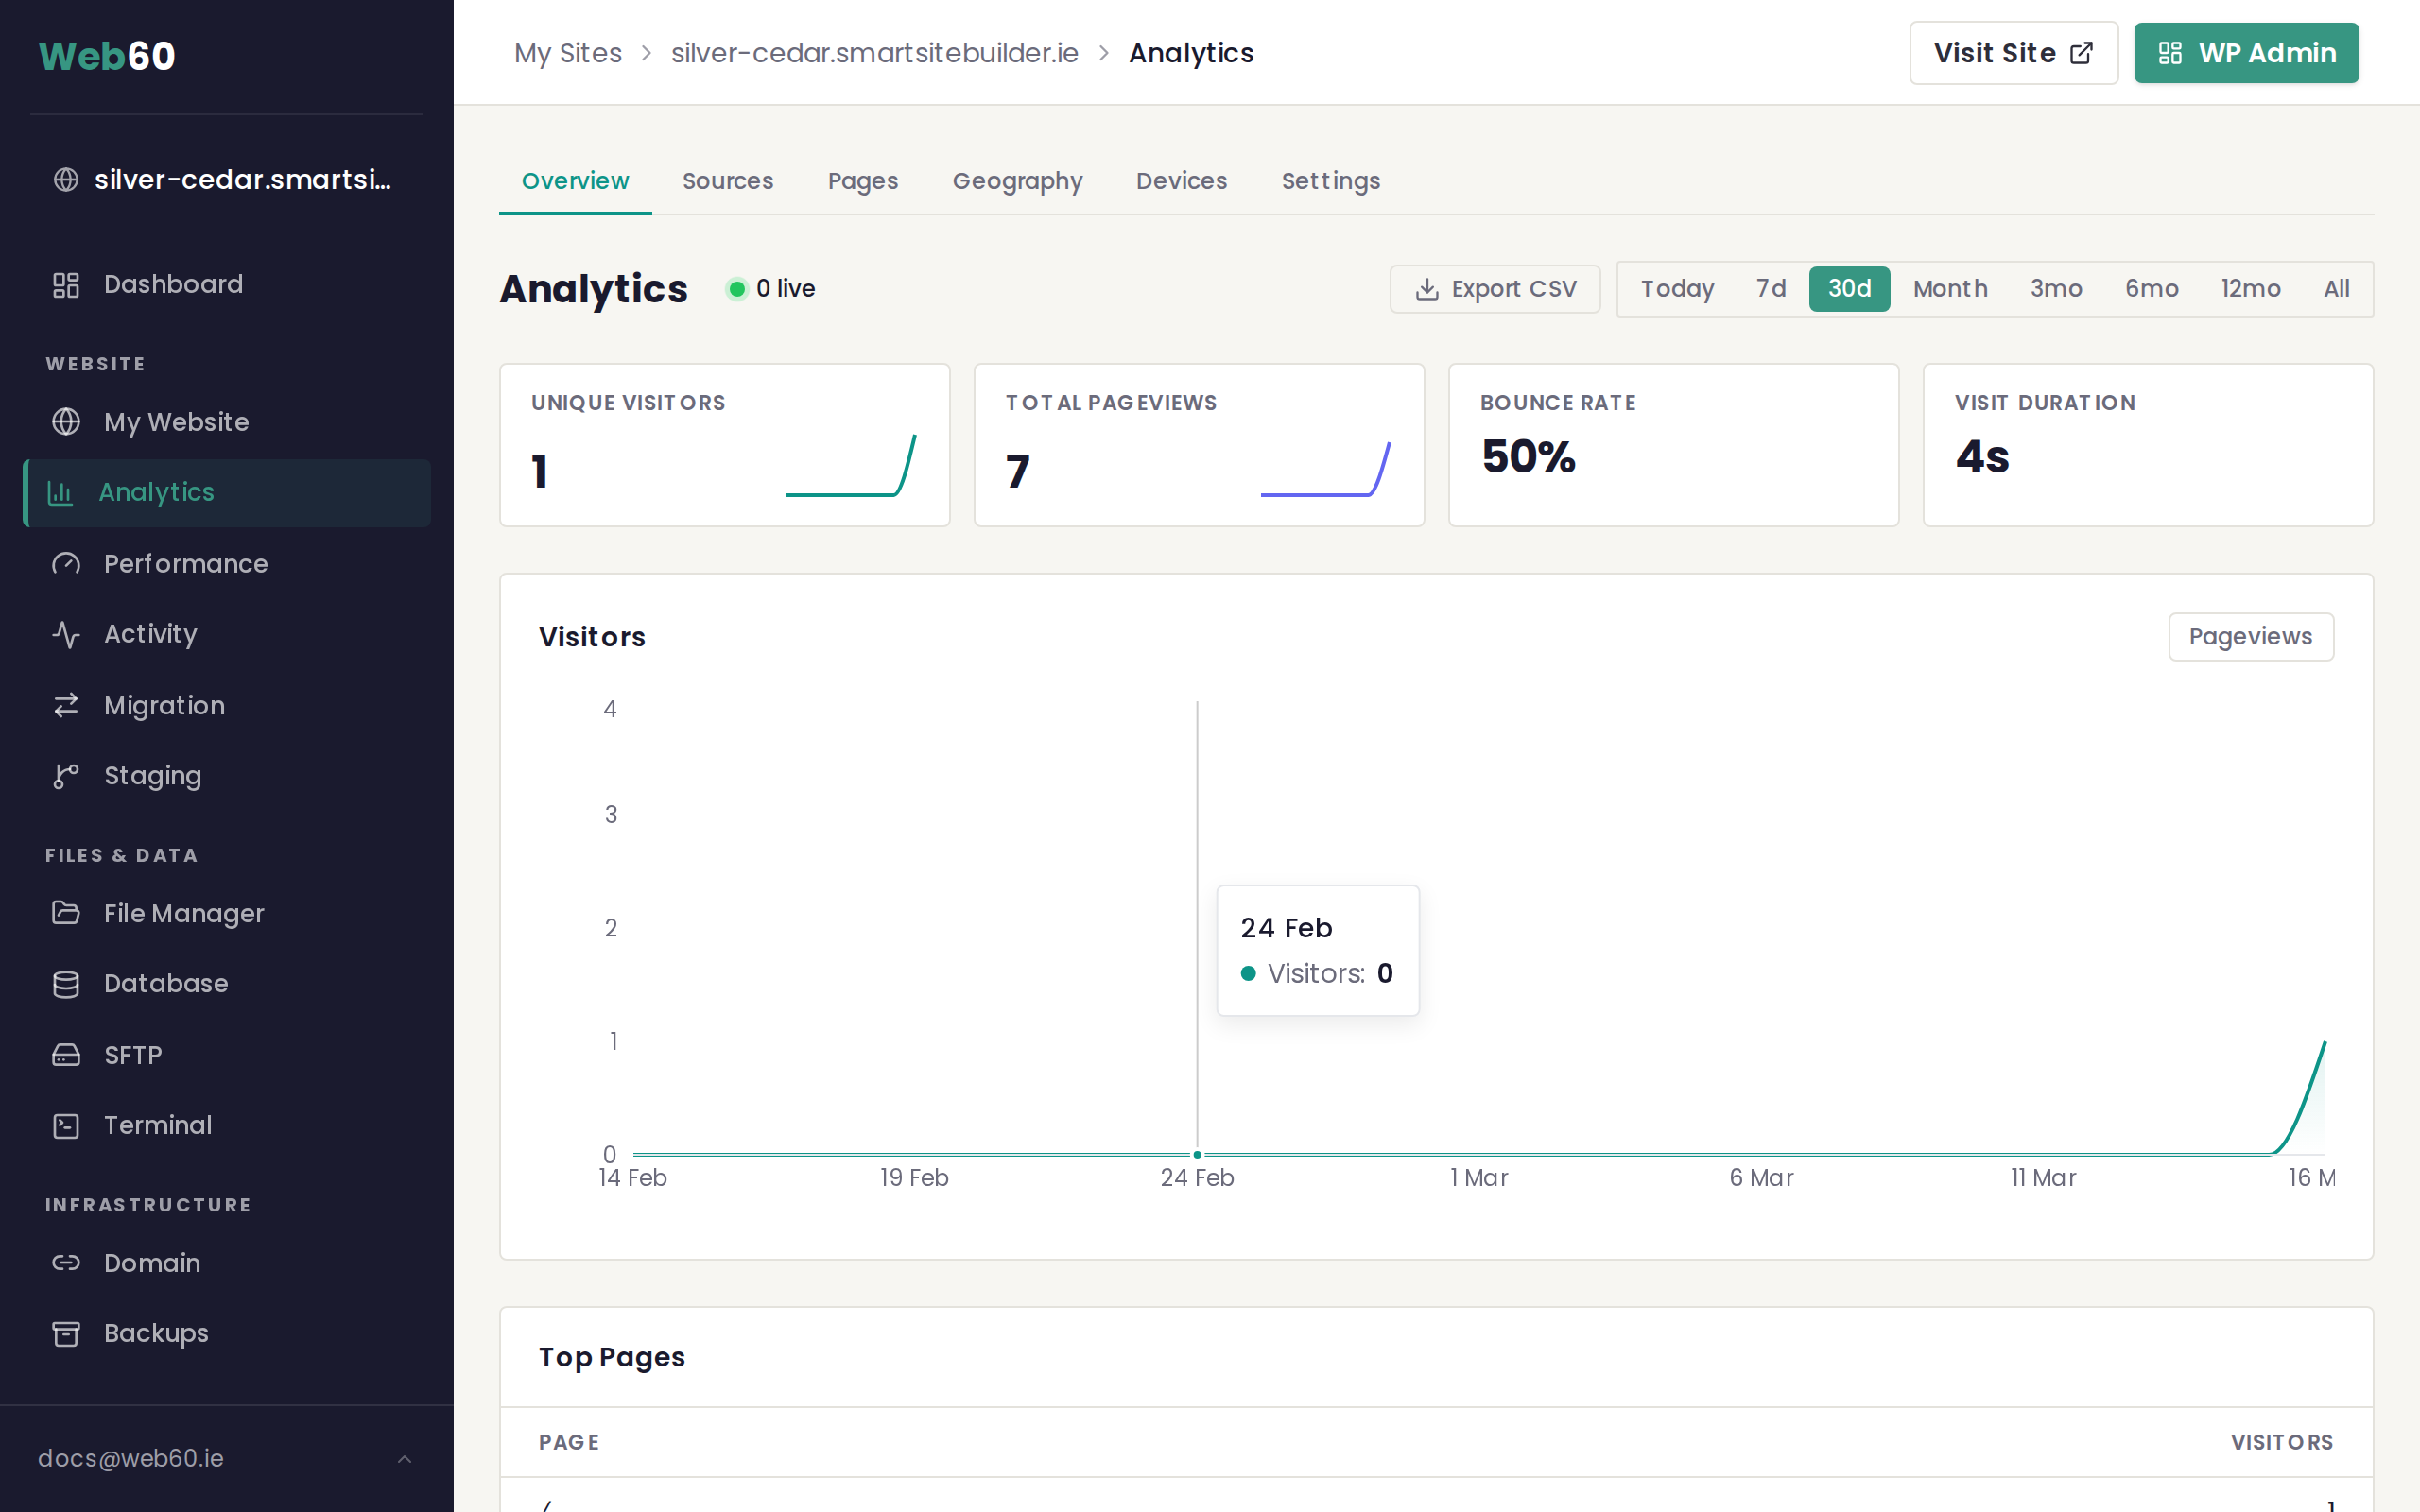
The overview page loads by default, showing summary cards at the top, a visitor chart in the middle, and a top pages table at the bottom.
The four summary cards
At the top of the page you will see four cards. Each one includes a number for the current period and a small percentage showing the change compared to the previous period.
- Unique Visitors is the number of individual people who visited your site. If the same person visits on Monday and again on Wednesday, they are counted once.
- Total Pageviews is the total number of pages that were loaded. If one visitor views five pages, that counts as five pageviews.
- Bounce Rate is the percentage of visitors who arrived and left without viewing a second page. A lower bounce rate generally means people are engaged with your content.
- Visit Duration is the average amount of time each visitor spent on your site per session.
The visitor chart
Below the cards is a line chart that plots your visitor numbers over time. You can toggle a Pageviews overlay using the button above the chart to compare both numbers side by side.
Choosing a date range
Use the period selector in the top right corner to change the time window. Options include today, the last 7 days, 30 days, 6 months, and 12 months. When you switch periods, the summary cards and chart update automatically.
The percentage change on each card compares the current period with the same length of time immediately before it. For example, selecting "Last 30 days" compares this month to the previous month.
Live visitors
Next to the Analytics heading you may see a green dot with a number. This shows how many people are browsing your website right now. It updates every 30 seconds.
Top pages
Below the chart is a table of your most visited pages during the selected period. For a more detailed breakdown, visit the Pages report.
What these numbers mean for your business
If you run a local Irish business, even modest visitor numbers can be meaningful. A steady increase in unique visitors suggests your site is being found by new people. A low bounce rate means those visitors are interested enough to explore further. And a healthy visit duration shows that your content is holding their attention.
Exporting your data
Click the Export button at the top of the page to download your analytics as a spreadsheet. This is useful for sharing traffic summaries with a colleague or keeping your own records.
Need help?
If you have questions about your analytics data, visit our support page and we will be happy to walk you through it.
Frequently asked questions
What is the difference between visitors and pageviews?
Visitors counts the number of individual people who came to your site during the selected period. Pageviews counts the total number of pages all those people viewed. One visitor who looks at four pages creates one visitor and four pageviews.
What is a good bounce rate for a small business website?
For most small business websites, a bounce rate between 30% and 60% is normal. If your bounce rate is above 70%, it may be worth reviewing your landing pages to make sure visitors can easily find what they need.
How often is the data updated?
Your analytics update throughout the day. The live visitor count beside the Analytics heading refreshes every 30 seconds, and your summary cards and charts update each time you load the page or change the date range.
Last updated: 16 March 2026