
Your Web60 dashboard includes a built-in analytics section that shows you how many people are visiting your website, which pages they look at, and where they come from. Everything is presented in plain English so you do not need any technical background to understand your traffic.
Where to find your analytics
- Log in to your Web60 dashboard.
- Select the website you want to check.
- Click Analytics in the left-hand sidebar.
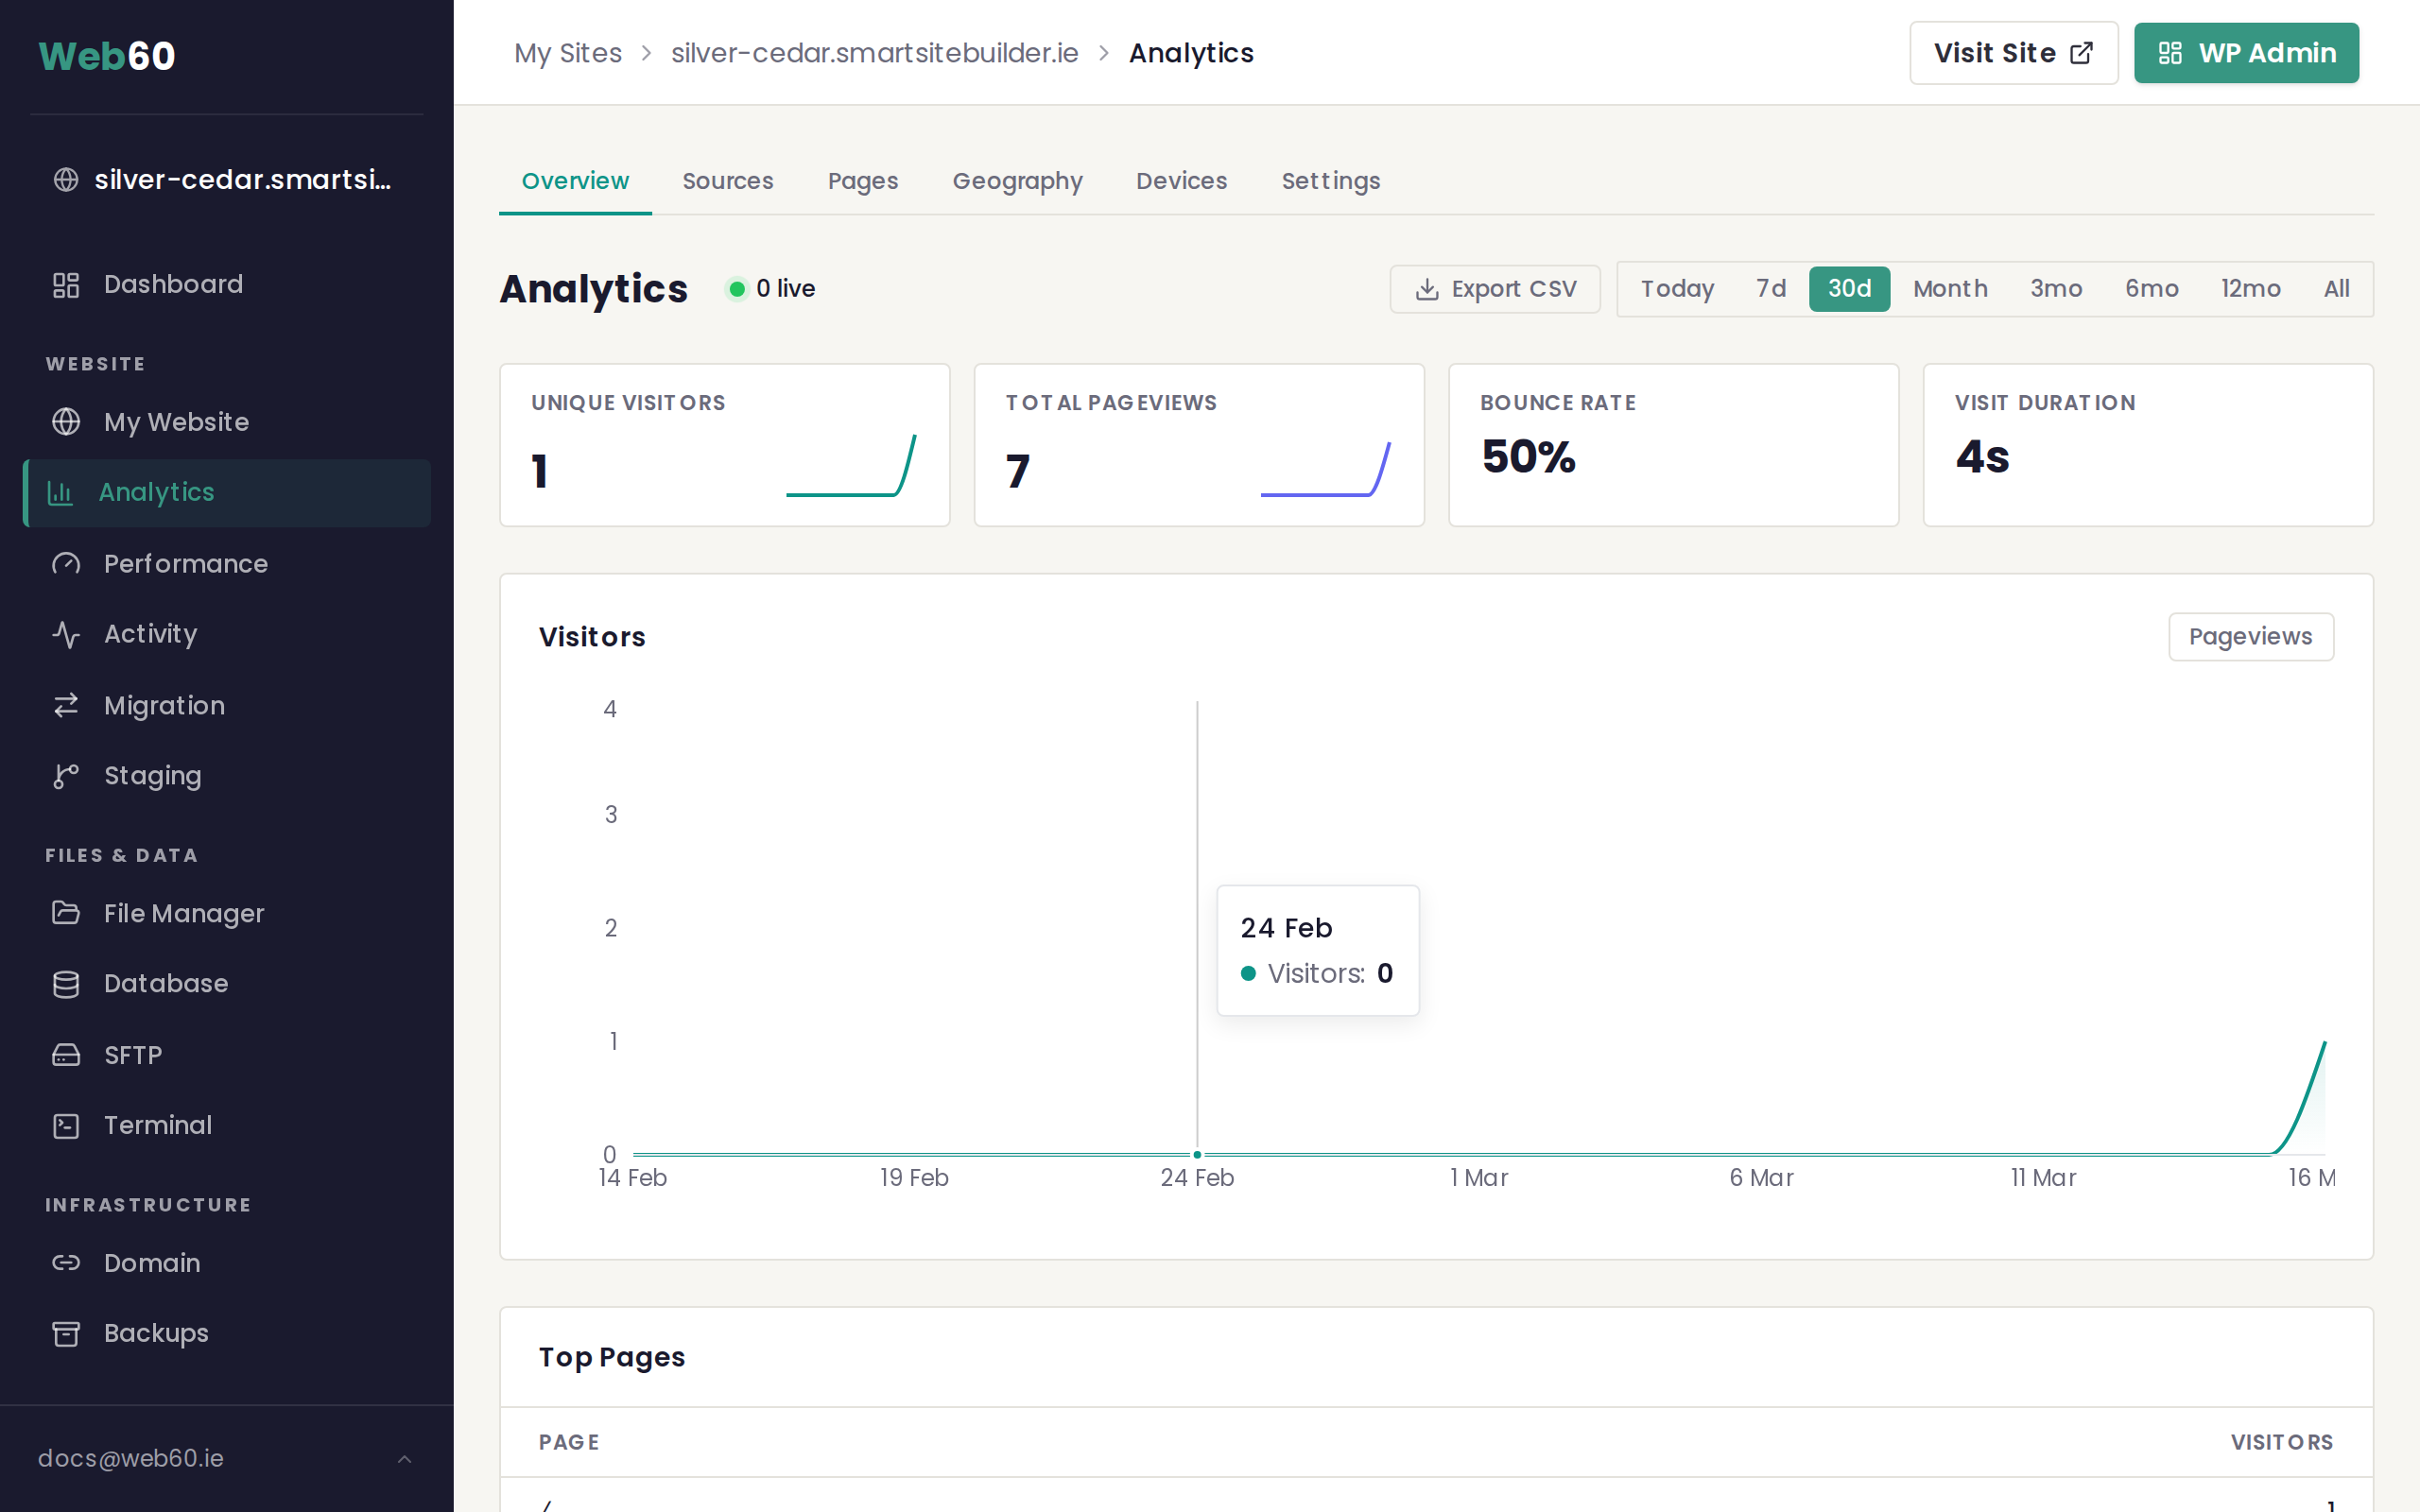
You will see the main overview page with a visitor chart and summary cards at the top.
The summary cards
At the top of the Analytics page you will see four cards:
- Unique Visitors shows how many individual people visited your website during the selected time period. If the same person visits twice, they are only counted once.
- Total Pageviews shows the total number of pages viewed. If one visitor looks at three pages, that counts as three pageviews.
- Bounce Rate shows the percentage of visitors who left after viewing only one page. A lower number is usually better because it means people are exploring your site.
- Visit Duration shows the average amount of time visitors spend on your site.
Each card may include a small percentage indicator showing whether that number has gone up or down compared to the previous period.
The visitors chart
Below the summary cards is a line chart showing your visitor numbers over time. By default it shows the last 30 days, but you can change the time period using the selector in the top right corner. Options include today, the last 7 days, 30 days, 6 months, and 12 months.
You can also toggle a Pageviews overlay on the chart to compare visitor numbers against total page views on the same graph.
Live visitors
Next to the Analytics heading you may see a small green dot with a number. This shows how many people are on your website right now, updated every 30 seconds.
Top pages
Below the chart you will find a Top Pages table listing the most popular pages on your website during the selected period. This helps you understand which content your visitors find most useful.
Additional analytics views
The Analytics section has several sub-pages you can explore using the navigation tabs:
- Pages gives a more detailed breakdown of every page on your site and how many visitors each one receives.
- Sources shows where your visitors are coming from, such as search engines, social media, or other websites that link to you.
- Devices shows what devices your visitors use, including whether they are on a desktop computer, a mobile phone, or a tablet.
- Geography shows which countries and cities your visitors are located in.
Privacy-first analytics
Web60 analytics are designed with privacy in mind. Unlike some analytics tools, we do not use tracking cookies, we do not follow your visitors across different websites, and we do not collect any personal information. Your visitors are counted anonymously so you get useful traffic data without compromising anyone's privacy.
Exporting your data
You can download your analytics data as a spreadsheet file by clicking the Export button at the top of the page. This is useful if you want to share your traffic numbers with a colleague or keep a record for your own files.
Changing the date range
Use the period selector at the top of the Analytics page to switch between Last 7 Days, Last 30 Days, and custom date ranges. When you change the period, all charts and tables update to show data for that window. The comparison feature shows how the current period compares to the previous one, so you can see whether traffic is going up or down.
What bounce rate means
A bounce is when someone visits your site and leaves without clicking on anything else. The bounce rate is the percentage of visitors who do this. For a typical small business website, a bounce rate between 40% and 60% is normal. If a specific page has a very high bounce rate, it might mean the content does not match what visitors expected to find, or that the page answered their question immediately (which is not always a bad thing). Check the Pages tab to see bounce rates for individual pages.
Need help?
If you have any questions about your analytics, visit our support page and we will be happy to explain anything further.
Frequently asked questions
What is the difference between visitors and pageviews?
Visitors counts the number of individual people who came to your site. Pageviews counts the total number of pages those people looked at. One visitor who views five pages creates one visitor and five pageviews.
What does bounce rate mean?
Bounce rate is the percentage of visitors who arrived on your site and left without clicking through to a second page. A lower bounce rate generally means people are finding your content interesting enough to explore further.
Is my visitors' personal information collected?
No. Web60 uses privacy-first analytics that does not use cookies, does not track individuals across websites, and does not collect personal information. You see totals and trends, not individual user details.
How long is my analytics data kept?
Your analytics data is available for up to two years. You can view trends over different time periods using the date range selector at the top of the page.
Last updated: 15 March 2026