
If you've noticed strange technical messages appearing on your website, such as lines of text with file names, numbers, or words like "warning" and "error", debug mode is probably turned on. Don't worry, this is not as serious as it sounds. This guide will explain what it means and how to fix it.
What is debug mode?
Debug mode is a diagnostic tool built into WordPress. When it's switched on, your website displays detailed error messages that can help identify problems. Think of it like turning on a warning light in your car. It shows you where the problem is, but it's not something you'd want your passengers to see.
These messages are meant for technical people who are investigating an issue. They're not meant to be visible to your customers.
How to tell if debug mode is on
You might notice one or more of these signs:
- Technical text appearing on your pages, often at the top of the page, in small print, mentioning file paths and line numbers.
- A warning on your Web60 dashboard. Your dashboard may show an alert telling you that debug mode is enabled.
- Your website looking messy. Error messages can push your content out of place or appear in unexpected spots.
How to turn debug mode off
If you see a debug mode warning on your Web60 dashboard:
- Sign in to your Web60 dashboard at app.web60.ie.
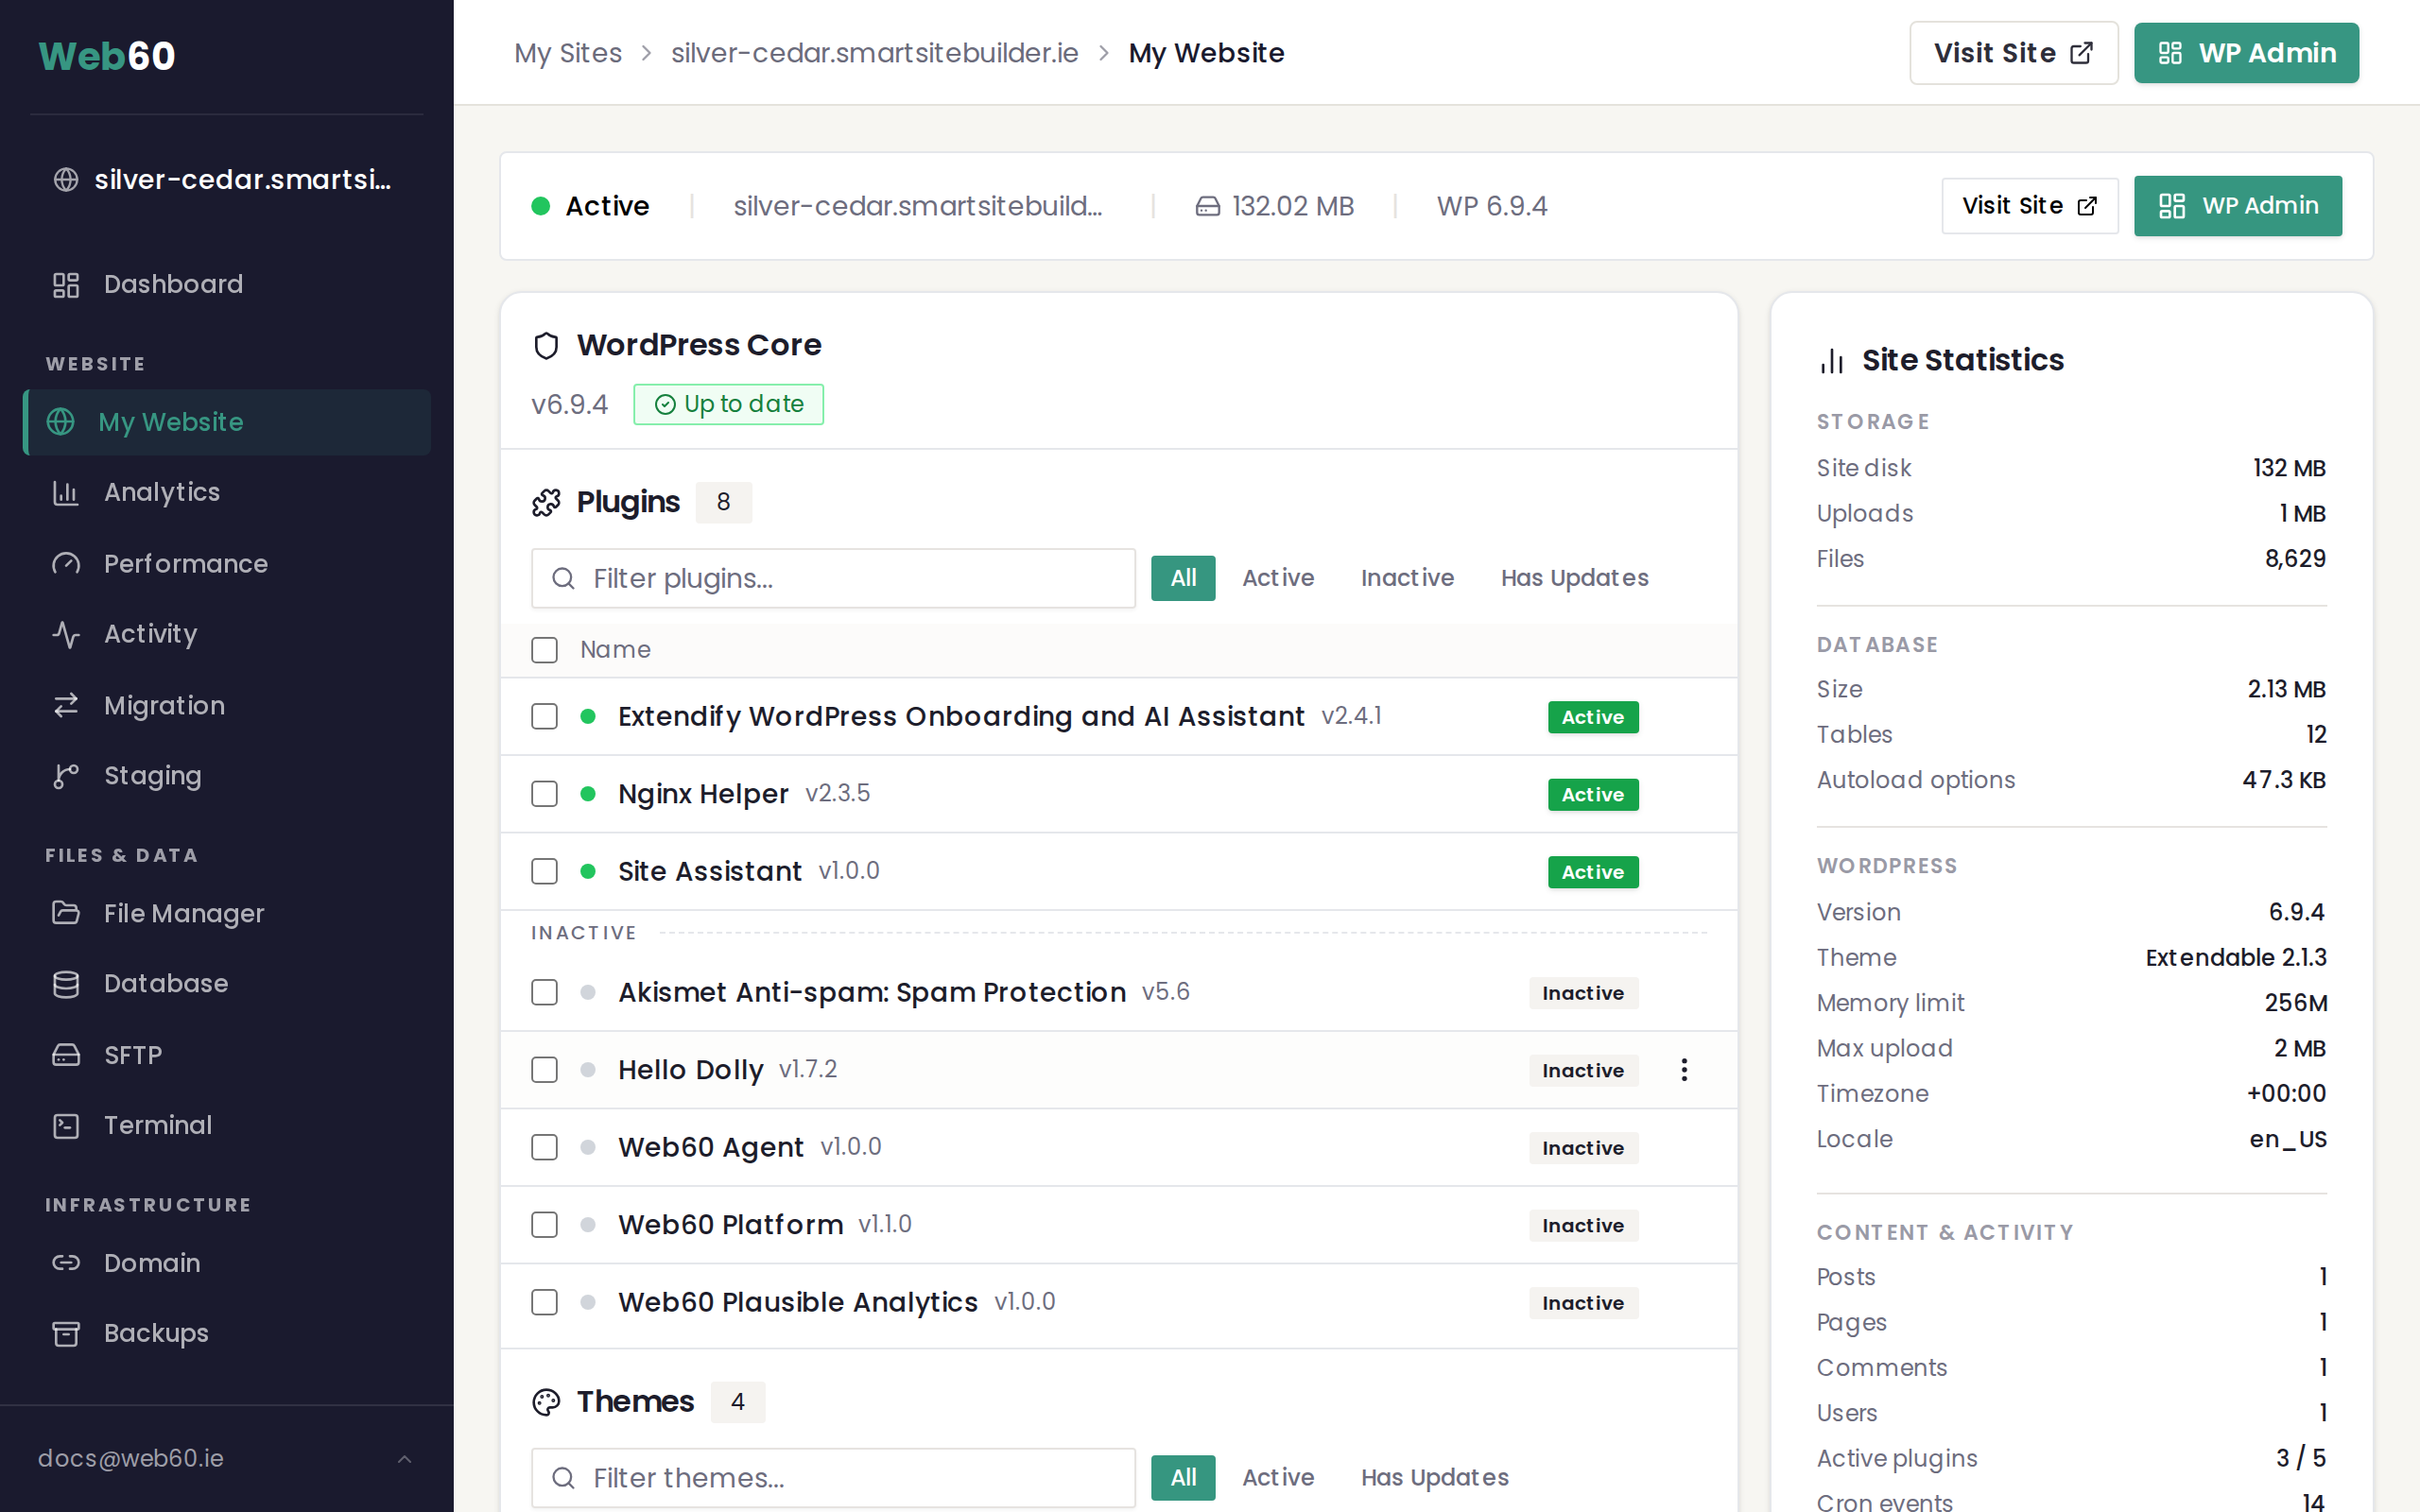
- Click "My Website" in the sidebar.
- Look for the debug mode warning or toggle.
- Follow the instructions shown to disable debug mode.
Your website will stop showing those technical messages immediately.
When debug mode is useful
Debug mode isn't all bad. There are times when it can be helpful:
- When troubleshooting a problem. If something on your site isn't working, turning on debug mode temporarily can help our support team figure out what's wrong.
- After installing a new plugin. If a plugin is causing issues, debug mode can reveal exactly what the conflict is.
However, it should always be turned off once the investigation is finished.
Why you should keep it turned off
Leaving debug mode on your live website is a bad idea for two reasons:
- It looks unprofessional. Your customers will see confusing technical messages that make your business look less trustworthy.
- It can reveal sensitive information. The error messages sometimes include details about your website's internal structure, which could be a security concern.
What the error messages mean
You don't need to understand the technical messages yourself. If you're curious, here's what they typically look like:
- "Warning" means something isn't quite right, but your website is still working.
- "Fatal error" means something has gone seriously wrong and part of your site may not be working.
- "Deprecated" means a feature your site uses is outdated and will stop working in a future update.
If you see any of these, the best thing to do is take a screenshot and send it to our support team. We'll know exactly what it means and how to fix it.
How to read the debug log
When debug mode is on, WordPress saves errors to a log file. You can view this log directly from your Web60 dashboard:
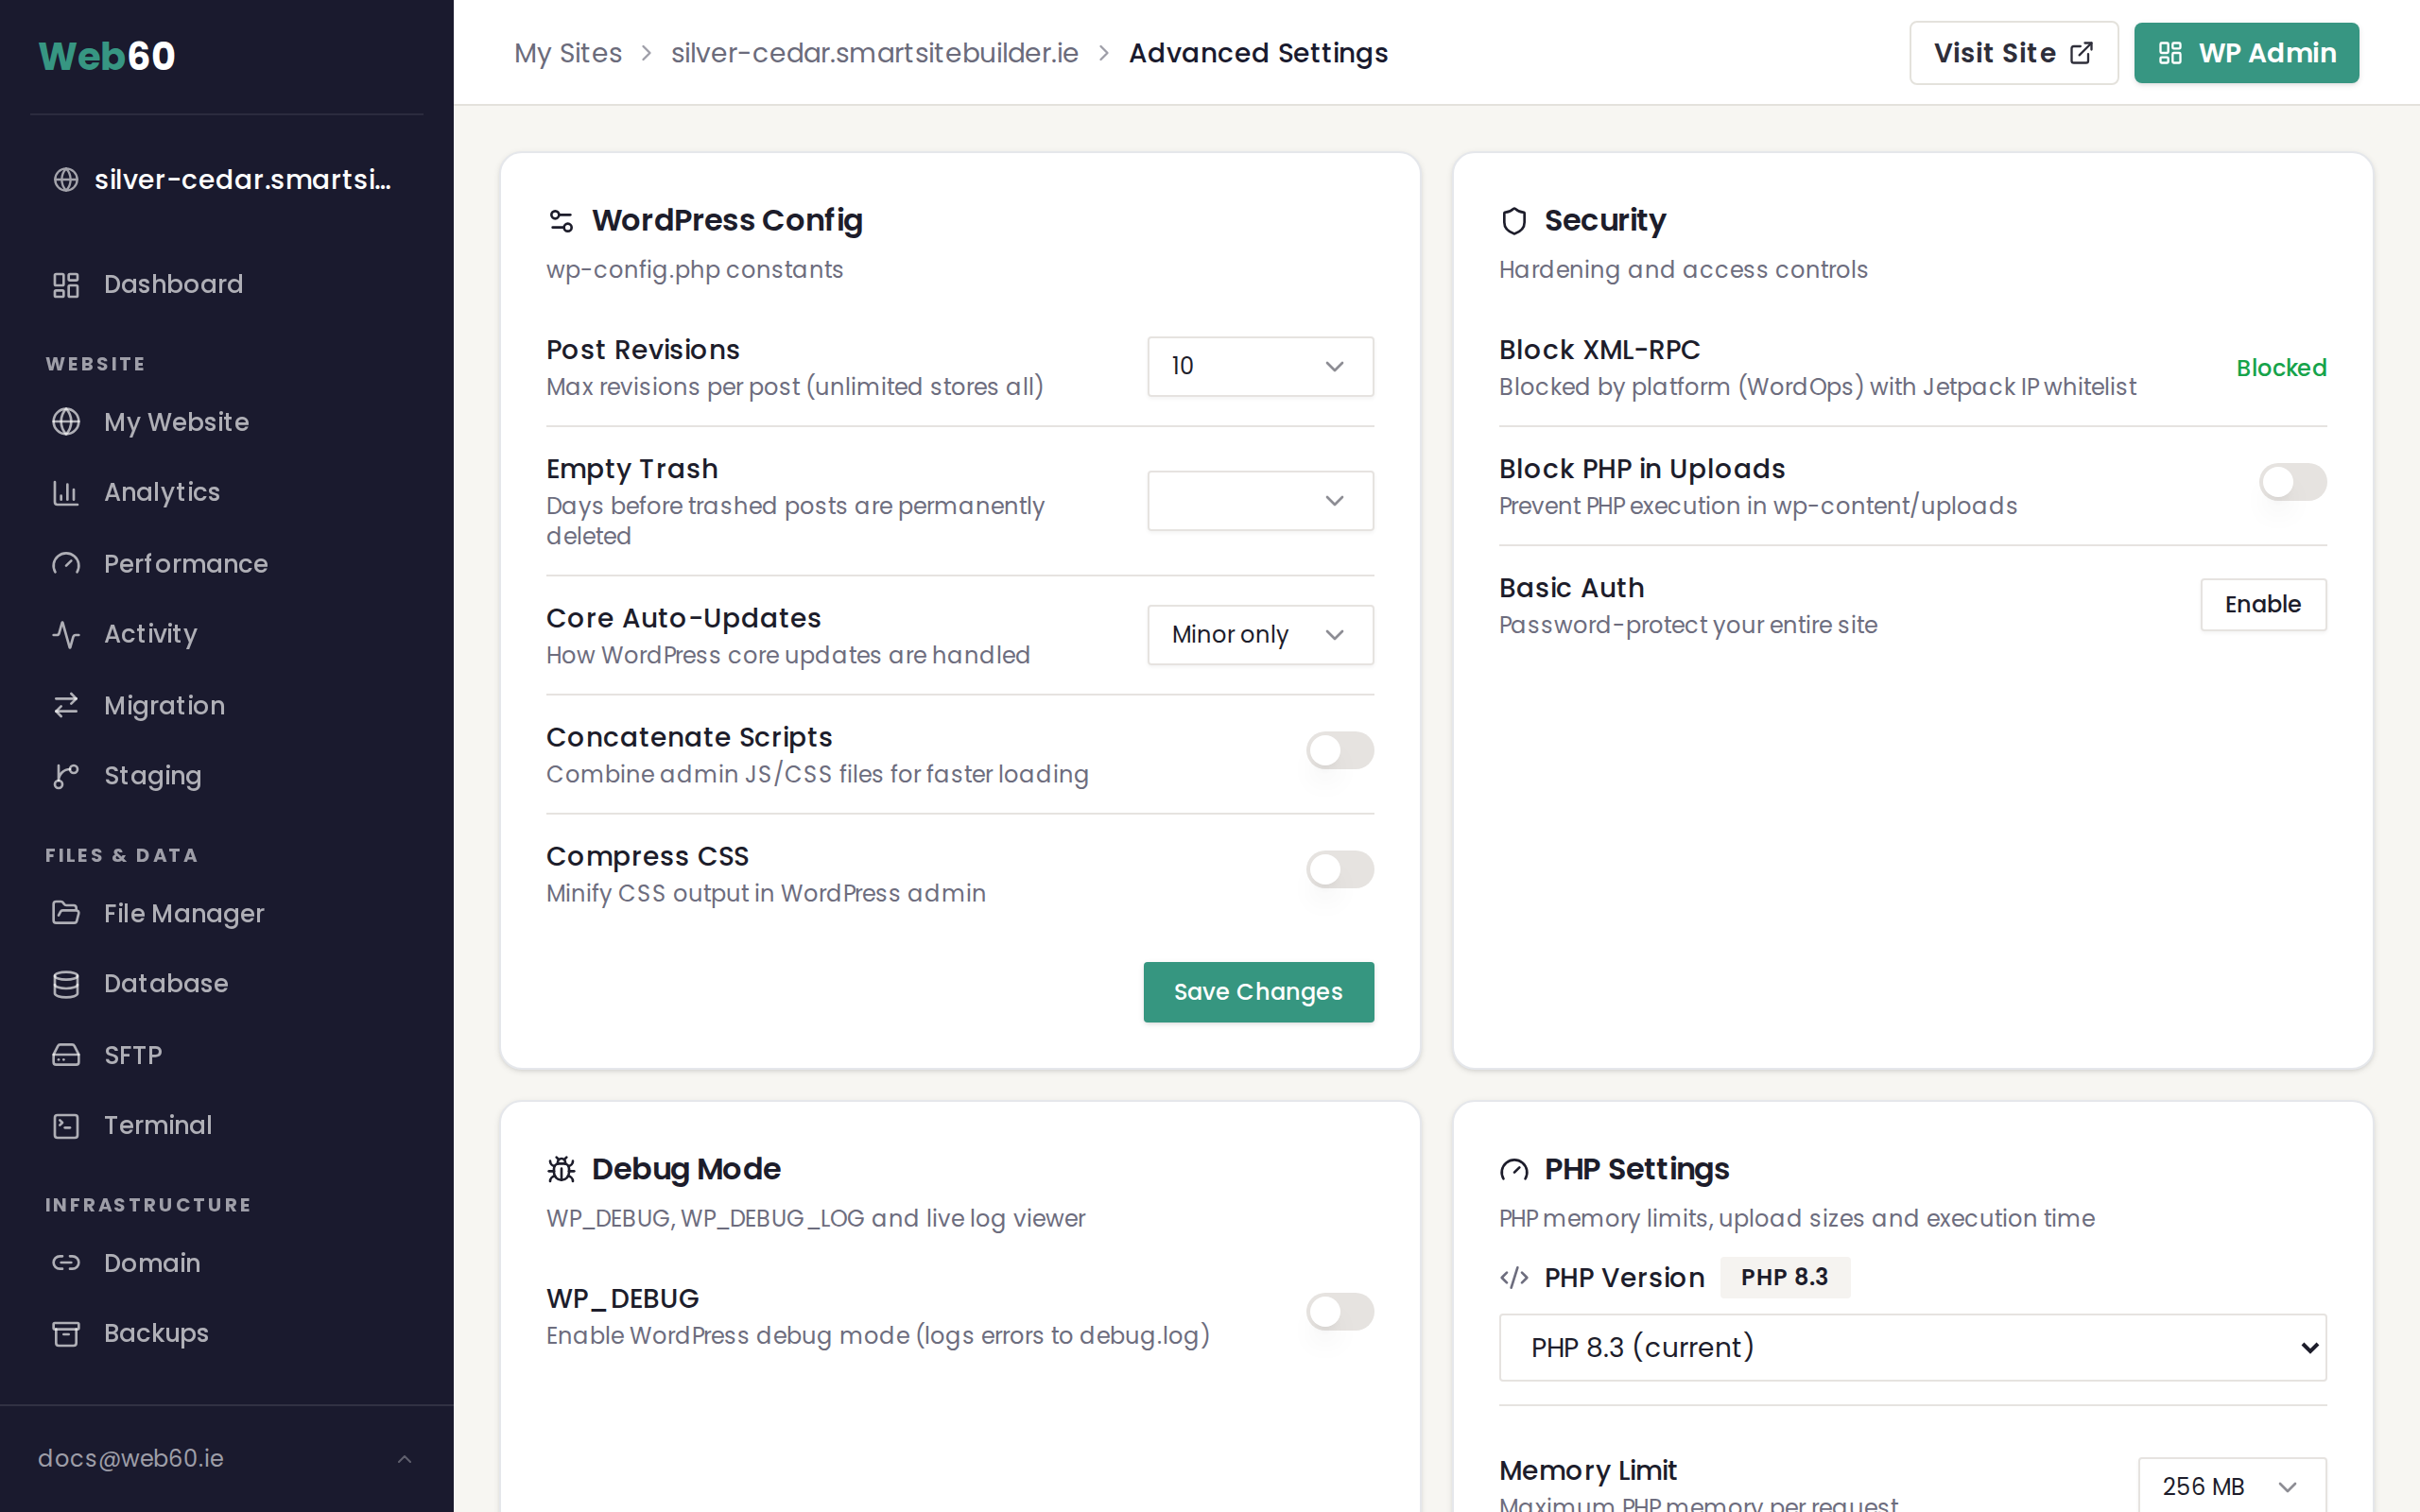
- Go to Advanced Settings in the sidebar.
- Find the Debug Mode card.
- Click View Log to open the live log viewer.
The log shows errors, warnings, and notices in real time. Each line starts with a date and time, followed by the type of message and where it occurred.
Here is what the different types mean:
- Fatal error is a serious problem that stopped the page from loading. The file name in the message often points to a specific plugin.
- Warning means something unexpected happened but the page still loaded.
- Notice is a minor issue that may not affect anything visible.
The log shows the last 200 lines. Older entries scroll off automatically.
Clearing the log
If the log has grown large or you have finished investigating, you can clear it:
- In the Debug Mode card, click the bin icon next to View Log.
- The log file is deleted and starts fresh from this point.
Check the log size in the Site Stats card on your My Website page. A debug log of several megabytes means many errors are being recorded and should be investigated.
Common errors and what they mean
- "Call to undefined function" usually means a plugin is trying to use a feature from another plugin that is not active. Try reactivating your plugins one by one to find the conflict.
- "Headers already sent" is often caused by a plugin or theme issue. Contact support if you see this repeatedly.
- "Maximum execution time exceeded" means a process is taking too long. You can increase the time limit in PHP Settings.
Need help?
If you're seeing error messages on your website or aren't sure whether debug mode is on, visit our support page and we'll take a look for you.
Frequently asked questions
Is it safe to have debug mode turned on?
It's safe in the short term for troubleshooting, but you should turn it off on your live website. Debug mode can show technical details that could be a security concern if left on permanently.
I didn't turn debug mode on, so why is it showing errors?
A plugin or a recent update may have enabled it. Sometimes it's turned on during troubleshooting and accidentally left on. Follow the steps in this article to turn it off, or contact our support team.
What should I do if I keep seeing errors even after turning debug mode off?
If your website has underlying issues, turning off debug mode simply hides the error messages but doesn't fix the problem. Visit our support page and we'll investigate what's going wrong.
Last updated: 15 March 2026